QLayoutItem *child;
while ((child = layout->takeAt(0)) != 0) {
    ...
    delete child;
}
11 Nisan 2018 Çarşamba
10 Nisan 2018 Salı
qt projeye kütüphane ekleme
*Qt mingw consolu acılır
*kullanılacak kutuphane dizinine gidilir
*qmake xx.pro
*mingw32-make
*mingw32-make install
*proje dizini dısında proje ile alakalı yeni bir dizin oldugu gözlenir
*oluşan dizin lib klasorunun adres yolu kopyalanır
*Denetim Masası -> sistem güvenlik->sistem->gelişmis ayarlar -> ortam degiskenleri tıklanır PATH kısmının en başına bu adres yolu eklenir
*Üst kısımdan "yeni" tıklanıp QMAKEFEATURES yazılır . path kısmına oluşan klasördeki features klasör yolu yapıştırılır "C:\Qwt-6.1.3\features" sonra tamama tıklanıp blgisyar yeniden başlatılır
QWT3 Canvasa Dikey Çizgi ile Koordinat takibi Yapmak (Curve Travker - QwtPlotPicker)
CurveTracker* tracker = new CurveTracker( this->canvas() );
// for the demo we want the tracker to be active without
// having to click on the canvas
tracker->setStateMachine( new QwtPickerTrackerMachine() );
tracker->setRubberBandPen( QPen( "MediumOrchid" ) );
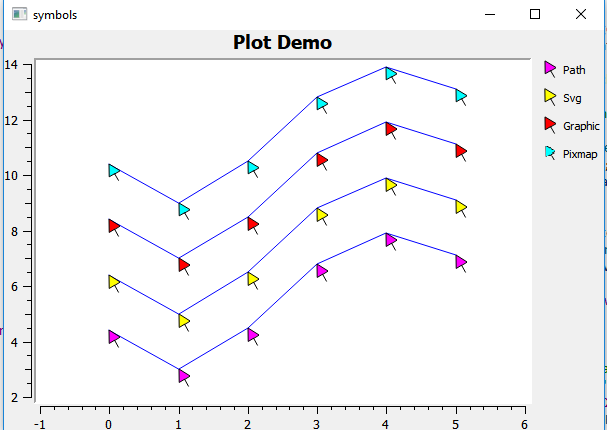
Nesne Boyama ve sembl
QwtPlot plot;plot.setTitle( "Plot Demo" );plot.setCanvasBackground( Qt::white );plot.setAxisScale( QwtPlot::xBottom, 0.0, 6.0 );// yatay x ekseni degerleri 1-6 arasıdırQwtLegend *legend = new QwtLegend(); // kateogoriler tanımlanıyorlegend->setDefaultItemMode( QwtLegendData::Checkable ); // kategoriler tıklanabilirplot.insertLegend( legend ); // kategoriler plota ekleniyor
Qwt2 Canvas ve iki nokta arası mesafe ölçme (canvas, distance picker,scatter point)
// canvas tanımlanıyor
canvas()->setStyleSheet(
"border: 2px solid Black;"
"border-radius:55px;"
"background-color: qlineargradient( x1: 0, y1: 0, x2: 0, y2: 1,"
"stop: 0 LemonChiffon, stop: 1 PaleGoldenrod );"
);
// attach curve
// Boyama Nesnesi tanımlanıyor
d_curve = new QwtPlotCurve( "Scattered Points" );
d_curve->setPen( QColor( "Orange" ) );
// when using QwtPlotCurve::ImageBuffer simple dots can be
// rendered in parallel on multicore systems.
// render ediliyor
d_curve->setRenderThreadCount( 0 ); // 0: use QThread::idealThreadCount()
d_curve->attach( this );
// cizim icin herhangi bir sembol tanımlanmıyor )
setSymbol( NULL );
// panning with the left mouse button
// canvas kaydırılabilir yapılıyor
(void )new QwtPlotPanner( canvas() );
// zoom in/out with the wheel
// mouse topu ile zoomlama aktif ediliyor
QwtPlotMagnifier *magnifier = new QwtPlotMagnifier( canvas() );
magnifier->setMouseButton( Qt::NoButton );
// distanve measurement with the right mouse button
//mouseun sag buttonu ile iki nokta arası mesafe ölçülüebiliyor
DistancePicker *picker = new DistancePicker( canvas() );
picker->setMousePattern( QwtPlotPicker::MouseSelect1, Qt::RightButton );
picker->setRubberBandPen( QPen( Qt::blue ) );
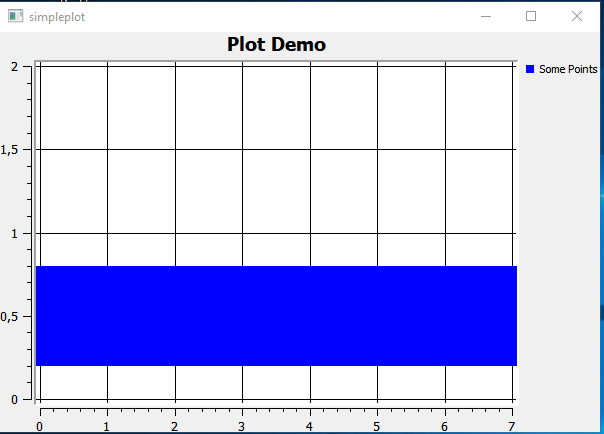
Qwt ile Koordinatları Çizme ve Boyama(QwtPlot,QwtPlotGrid,QwtPlotCurve Kullanımı)
QwtPlot plot;
plot.setTitle( "Plot Demo" ); //baslık adı
plot.setCanvasBackground( Qt::white ); // arka plan rengi
plot.setAxisScale( QwtPlot::yLeft, 0.0, 2.0 ); // y eksenin degerleri
plot.insertLegend( new QwtLegend() ); // plota tanımlayıcı legend ekleme
QwtPlotGrid *grid = new QwtPlotGrid(); // Plota ızgara ekleme
grid->attach( &plot );
QwtPlotCurve *curve = new QwtPlotCurve(); // Plotu boyamak ve boyanan özelligin adı ve renginin tanımlanması
curve->setTitle( "Some Points" );
curve->setPen( Qt::blue,100);
curve->setRenderHint( QwtPlotItem::RenderAntialiased, true );
QPolygonF points; // cizilecek poligon noktaları
points << QPointF( 0,0.5 ) << QPointF( 1, 0.5 ) << QPointF( 2.0,0.5 ) << QPointF( 3.0,0.5) << QPointF( 4.0, 0.5) << QPointF( 5.0,0.5) << QPointF( 6.0, 0.5) << QPointF( 7.0,0.5);
curve->setSamples( points ); // noktaların boyama nesnesine atanması
curve->attach( &plot ); // boyama nesnesinin plota eklenmesi


