QwtPlot plot;
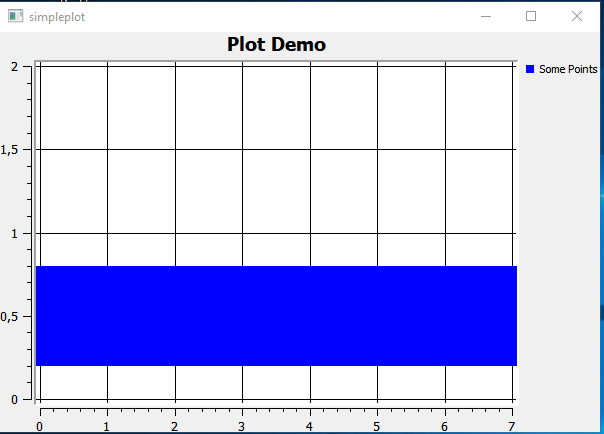
plot.setTitle( "Plot Demo" ); //baslık adı
plot.setCanvasBackground( Qt::white ); // arka plan rengi
plot.setAxisScale( QwtPlot::yLeft, 0.0, 2.0 ); // y eksenin degerleri
plot.insertLegend( new QwtLegend() ); // plota tanımlayıcı legend ekleme
QwtPlotGrid *grid = new QwtPlotGrid(); // Plota ızgara ekleme
grid->attach( &plot );
QwtPlotCurve *curve = new QwtPlotCurve(); // Plotu boyamak ve boyanan özelligin adı ve renginin tanımlanması
curve->setTitle( "Some Points" );
curve->setPen( Qt::blue,100);
curve->setRenderHint( QwtPlotItem::RenderAntialiased, true );
QPolygonF points; // cizilecek poligon noktaları
points << QPointF( 0,0.5 ) << QPointF( 1, 0.5 ) << QPointF( 2.0,0.5 ) << QPointF( 3.0,0.5) << QPointF( 4.0, 0.5) << QPointF( 5.0,0.5) << QPointF( 6.0, 0.5) << QPointF( 7.0,0.5);
curve->setSamples( points ); // noktaların boyama nesnesine atanması
curve->attach( &plot ); // boyama nesnesinin plota eklenmesi

